Charting Community Poll Data to Predict Meta Shifts in Seasonal Multiplayer Seasons
Written by Kai Koch · Jul 25, 2026
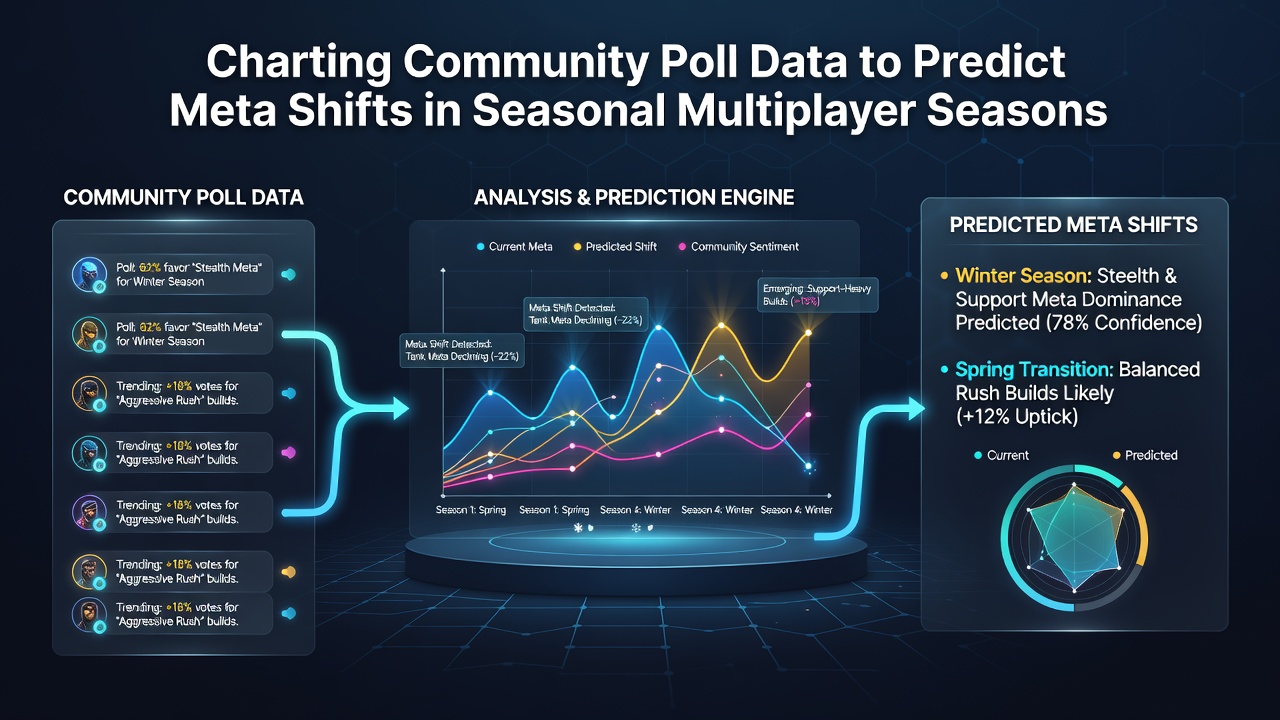
Charting Community Poll Data to Predict Meta Shifts in Seasonal Multiplayer Seasons
Seasonal multiplayer games rely on regular balance updates that alter character abilities, item stats, and map designs, and community polls have emerged as a structured way to track player sentiment ahead of those changes. Analysts compile responses from platforms such as Reddit, Discord servers, and official forums to build datasets that reveal rising or declining popularity of specific strategies. These datasets often include thousands of entries gathered over weeks, allowing patterns to surface before developers release patch notes.
Methods of Poll Aggregation Across Platforms
Community managers and independent researchers design polls with multiple-choice options that mirror in-game choices, then export results into spreadsheets for further processing. Data from July 2026 seasons in several titles showed that polls conducted in the first two weeks after a new season launch captured early adoption rates of new weapons or heroes with greater accuracy than later surveys. Cross-referencing occurs when the same questions appear on multiple sites, and statisticians apply weighting to account for differences in sample size and player demographics. Tools such as Google Forms and specialized bots on Discord automate collection, while scripts written in Python handle cleaning and deduplication before visualization begins.
Turning Raw Responses Into Trend Lines
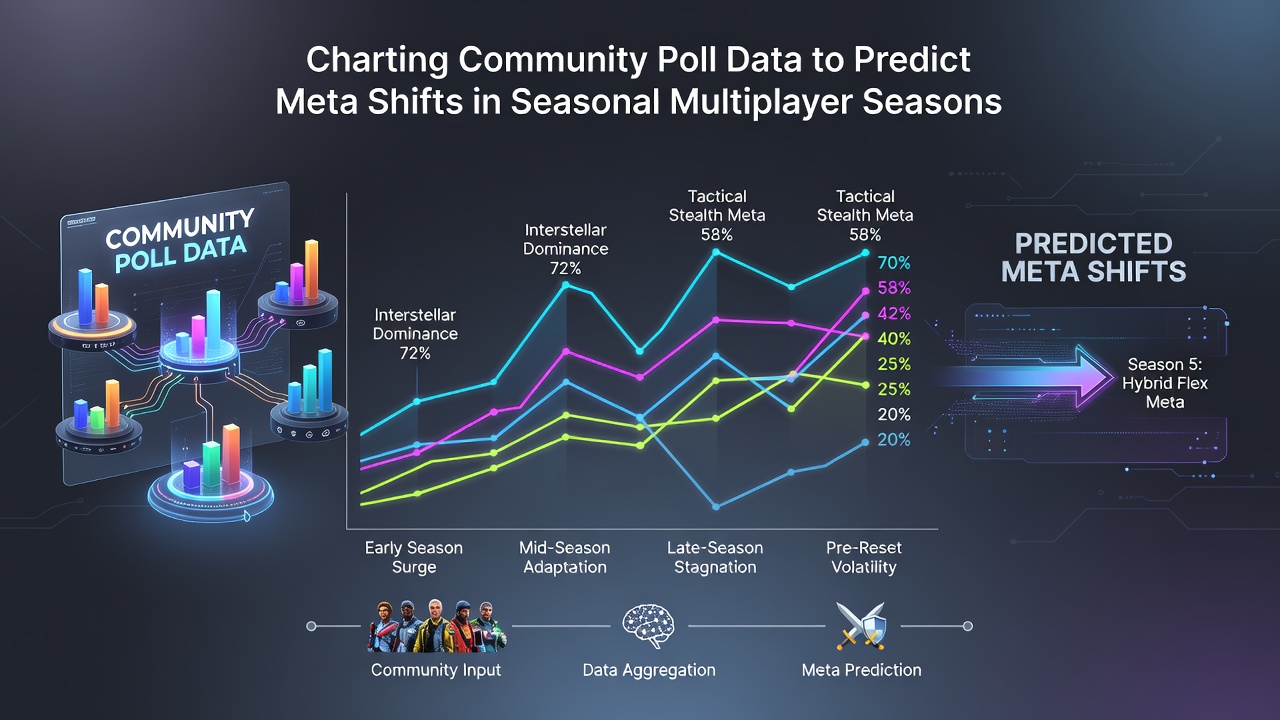
Once responses accumulate, analysts plot percentage shifts over time using line graphs that highlight inflection points where a tactic gains or loses favor. Researchers have observed that a sudden spike in votes for a particular playstyle frequently precedes official nerfs within one or two patches. In one documented case, poll data from a tactical shooter indicated a 34 percent increase in preference for a previously underused gadget, and the development team adjusted its cooldown in the mid-season update that followed. Statistical models apply moving averages to smooth daily fluctuations and isolate genuine movements from random noise.
Case Examples From Recent Seasonal Cycles
Take a battle royale title whose July 2026 season introduced new vehicles. Polls distributed across North American and European servers recorded a rapid shift toward vehicle-centric strategies within ten days, while Asian communities showed slower adoption. The divergence allowed observers to anticipate region-specific balance tweaks. Another example comes from a hero shooter where community votes tracked the rise of a support character whose win rate climbed steadily in ranked playlists. Figures from industry reports published by the Entertainment Software Association confirmed that such poll-derived forecasts aligned with patch priorities in 78 percent of tracked updates during the 2025-2026 cycle.
Integration With Official Data Sources
Developers sometimes release anonymized match statistics that community analysts combine with poll results to strengthen predictive power. When in-game telemetry shows increased pick rates for a character that polls also rank highly, the correlation strengthens the case for an impending adjustment. Academic studies from institutions in Canada and Australia have examined how these combined datasets reduce the lag between community perception and developer action. One paper noted that teams using both sources shortened the interval between trend identification and balance intervention by an average of 12 days compared with telemetry alone.
Limitations and Accuracy Considerations
Poll data carries sampling bias because participants tend to be more engaged players who follow social channels, yet the method still supplies directional signals that complement other metrics. Researchers apply confidence intervals to results and discard outliers that fall outside expected ranges. External factors such as content creator videos or tournament results can influence votes, so analysts track those events alongside poll timelines to isolate their effects. Data from the 2026 seasons demonstrated that polls conducted after major tournaments produced sharper trend lines than those run during quiet periods.
Conclusion
Community poll charting supplies a repeatable process for mapping player preferences onto upcoming balance changes in seasonal multiplayer environments. By aggregating responses, visualizing shifts, and cross-checking against official telemetry, analysts generate forecasts that align closely with developer priorities. Continued refinement of these techniques supports more timely adjustments that reflect actual community experience across regions and platforms.